
Health & Performance · Measurement guide
What Does Heart Rate Variability Measure?
HRV measures changes in timing between normal heartbeats. It can reveal how a coupled cardiovascular control system behaves under specific conditions. It cannot reduce stress, recovery or the nervous system to one score.
A heart beating 60 times per minute does not normally place every beat exactly one second apart. One interval may last 980 milliseconds, the next 1,030 and the next 995. Heart rate variability, or HRV, describes this beat-to-beat variation.
That sounds like a narrow measurement. Consumer wearables often turn it into a much larger claim: readiness, resilience, stress or recovery. Those interpretations can sometimes be useful, but they are not what the sensor directly measures. The sensor detects electrical beats or pulse waves. Software cleans the intervals, calculates a metric and may combine it with sleep, activity and other signals. Only then does an app produce a score.
The distinction matters. HRV is feedback, not a verdict. A changing value may help you ask better questions about sleep, training, illness, alcohol, stress or measurement conditions. One value cannot tell you which answer is correct.
What heart rate variability actually measures
So, what does heart rate variability measure? In its most defensible form, it measures variation in the duration of successive intervals between normal beats. On an electrocardiogram, researchers usually work with RR intervals, the time between successive R waves. After abnormal beats and artefacts are handled, the remaining normal-to-normal intervals are often called NN intervals.
HRV is therefore not the same as heart rate. Heart rate compresses a period into an average number of beats per minute. HRV retains part of the timing pattern inside that period. Two people can both average 60 beats per minute while having different sequences of intervals and different HRV values.
The normal rhythm begins in pacemaker tissue, but beat timing is continually modulated. Parasympathetic cardiac activity can alter timing rapidly. Sympathetic effects generally unfold more slowly. Breathing changes vagal outflow and pressure inside the chest. Blood-pressure reflexes, movement, temperature, hormones, metabolic demand and the current state of the heart and blood vessels all contribute.
The final interval series is an output of that interaction. It is not a recording of a single controller.
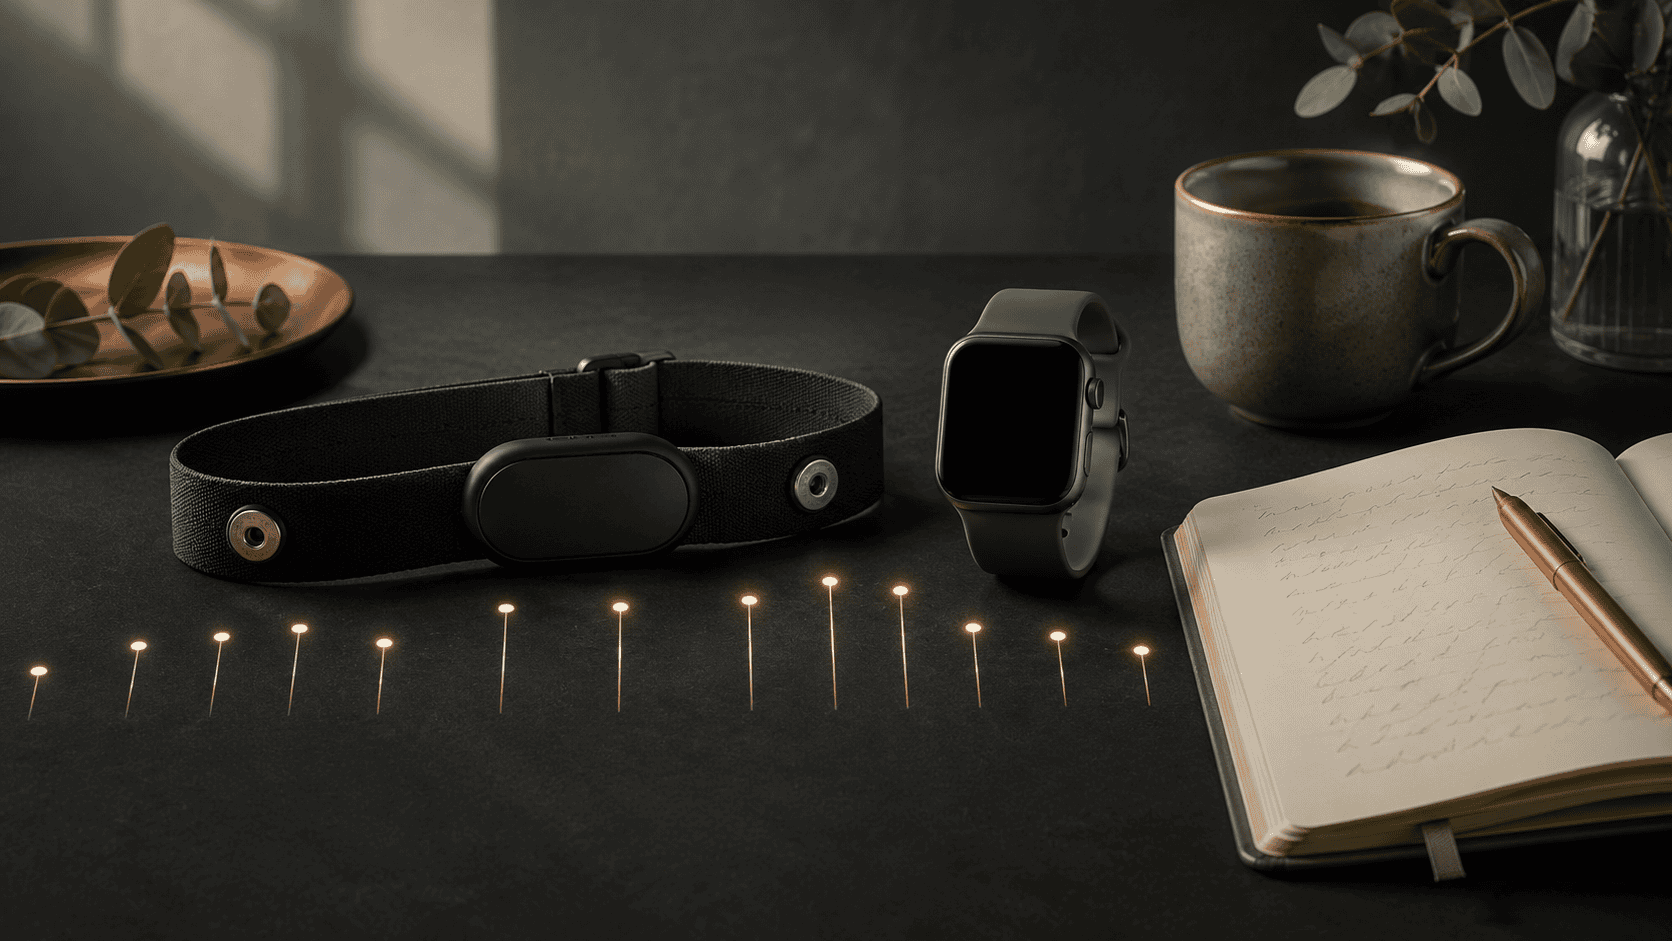
Why HRV is variability between beats, not heart rate
Imagine two five-beat sequences. In the first, every interval is almost identical. In the second, intervals shorten and lengthen around the same average. Their mean heart rate can match while their variability differs.
This is why “a low resting heart rate” and “high HRV” are not interchangeable achievements. Training status can influence both, but so can age, genetics, medication, illness and measurement context. A slower heart rate also creates more mathematical room for interval variation. Comparisons that ignore heart rate can therefore be misleading.
Before interpreting any number, identify what was measured:
- electrical RR intervals from ECG or an electrode-based chest strap;
- pulse-to-pulse intervals, often called pulse rate variability or PRV, estimated by an optical sensor;
- a short waking measurement or an overnight series;
- a raw metric such as RMSSD or a proprietary readiness score.
These outputs may correlate. They are not automatically interchangeable.
Cleaning matters too. HRV calculations assume that the intervals represent the rhythm being studied. Missed detections, double-counted pulse peaks, movement and poor skin contact can create false variation. Software may remove or replace suspicious intervals, but aggressive correction can also reshape the signal. A polished number does not guarantee a clean recording. When a value suddenly looks implausible, inspect the recording-quality indicator and repeat the measurement under calm conditions before giving the change a physiological story.
How the autonomic nervous system influences HRV
The autonomic nervous system helps regulate circulation without requiring conscious commands for every beat. Parasympathetic signals reaching the heart through vagal pathways can change sinoatrial timing quickly. Sympathetic pathways can raise rate and contractility and alter cardiovascular responses to demand.
Short resting HRV, especially successive-beat measures, is often used as an index of cardiac parasympathetic modulation. That wording is careful. It does not mean HRV directly measures the vagus nerve. The same vagal input can produce different interval patterns at different breathing rates, postures and heart rates. The mechanical and vascular system through which the signal operates also matters.
Nor does HRV provide a simple percentage split between sympathetic and parasympathetic activity. Both branches can change together, and frequency components are shaped by more than one process. The popular LF/HF “balance” interpretation is too simple for a coupled control system.
Why HRV is not a direct vagus-nerve or ICNS score
The intrinsic cardiac nervous system is a local network embedded in the wider control architecture of the heart. HRV does not count its neurons, isolate its firing or show which intracardiac circuit is active.
HRV also does not directly read central “vagal tone.” It records the timing consequences that emerge after neural signals interact with pacemaker cells, breathing, pressure reflexes and cardiovascular tissue. A slow-breathing session can increase some HRV metrics during the exercise. That is not proof that a particular nerve or local cardiac circuit has become stronger.
HRV is an output of a coupled system, not a window into one hidden controller.
This boundary makes the metric more useful. It replaces a vague promise with a concrete question: under comparable conditions, how does this person’s interval pattern change over time?
Breathing, posture and measurement conditions
Breathing changes heart timing. Heart rate commonly rises during inspiration and falls during expiration, a pattern called respiratory sinus arrhythmia. Its size depends partly on breathing rate and depth. Deliberately slow or deep breathing can therefore change the result while it is being measured.
Posture changes the circulation’s control problem. Lying down, sitting and standing redistribute blood and alter reflex demands. Recent movement, talking, a meal, room temperature and the time allowed to settle can add further variation.
A useful personal series standardizes the conditions it can control:
- use the same device and metric;
- measure at approximately the same time;
- use the same posture;
- keep recording length consistent;
- rest quietly before measuring;
- breathe naturally unless paced breathing is the experiment;
- note unusual artefacts or interruptions.
Consistency does not make the number clinically diagnostic. It makes day-to-day comparisons less confused.

Sleep, exercise, illness, alcohol, medication and stress
HRV responds to context, but not with a universal one-cause-one-number rule.
Exercise and training can change HRV, but the direction and meaning depend on when the measurement is taken, the load and the person’s adaptation. Sleep restriction sometimes reduces vagally associated measures, yet controlled studies do not all produce the same result. Protocol, sleep stage, posture, population and metric matter.
In one small controlled study, parenteral ethanol administration reduced standard HRV measures in 15 healthy participants. That result does not quantify the effect of ordinary drinking for every individual. Inflammatory and infectious states have also been associated with lower HRV in clinical studies, but HRV alone cannot diagnose an infection. Psychological stress can lower short-term HRV in some settings, but movement, breathing and anticipation can travel with the stressor.
Some medicines can affect variables involved in HRV interpretation. The direction and importance cannot be generalized across drugs, doses, reasons for treatment and individuals. Never stop, start or adjust medication to improve an HRV score.
A low value can be compatible with poor sleep, heavy training, alcohol, illness, worry, measurement error or ordinary biological variation. The measurement alone cannot choose among them.
RMSSD, SDNN and wearable readiness scores
RMSSD
RMSSD is the root mean square of successive differences between normal intervals. It gives greater weight to short-term beat-to-beat changes and is commonly used for brief resting or overnight measurements. Apps often transform it logarithmically because individual values are skewed.
SDNN
SDNN is the standard deviation of normal intervals. It reflects variability present across the recording. Duration matters enormously: SDNN from five minutes does not represent the same set of rhythms as SDNN from 24 hours.
Readiness and recovery scores
A readiness score is a model output, not an HRV unit. Depending on the product, it may combine HRV with resting heart rate, sleep estimates, recent activity and a personal baseline. It should therefore not be treated as a raw HRV measurement.
That makes scores useful as prompts but poor as universal rankings. Compare like with like and retain access to the underlying metric when possible.
Why personal baselines matter more than population rankings
HRV varies substantially between people and measurement protocols. Age and some sex-related differences are documented even in healthy samples; fitness, health, medication and measurement method can add further variation. A value that is usual for one person and protocol may be unusual for another.
A personal baseline is not one magic average. Think of it as a range built from repeated comparable observations. Look for changes that persist, coincide with other evidence and make sense in context.
A trend can still mislead. Changing devices, switching from seated morning readings to overnight wrist measurements or adopting paced breathing can create an apparent improvement without a comparable physiological change. Baselines belong to a protocol as much as to a person.
How to run a controlled seven-day HRV experiment
This experiment is for learning about measurement consistency, not diagnosing recovery.
- Choose one method. Use one device, one metric, one posture and one recording length for seven mornings.
- Measure before inputs multiply. If practical, measure after waking and using the bathroom, before caffeine, breakfast or exercise.
- Settle first. Remain quiet in the chosen posture and breathe normally.
- Record context. Note sleep duration, unusual training, alcohol, illness symptoms, medication changes prescribed by a clinician and major stressors.
- Do not chase the score. Keep normal plans unless symptoms, medical advice or ordinary training judgment say otherwise. Stop the experiment and seek appropriate medical advice if concerning symptoms occur.
- Review after seven days. Ask whether readings were technically consistent and whether any pattern repeated. Do not invent a cause from one coincidence.
Seven days may reveal obvious inconsistencies in measurement conditions, but it is usually too short to define a stable physiological baseline. Continue longer only if tracking remains calm and useful rather than compulsive.

When irregular measurements or symptoms need medical assessment
Optical sensors can mistake movement, poor contact or pulse-wave changes for timing variation. Ectopic beats and rhythm disturbances can also produce interval patterns that inflate or destabilize HRV calculations. A consumer score cannot reliably separate every artefact from every arrhythmia.
Discuss recurrent palpitations, unexplained exercise intolerance or repeatedly irregular readings with a qualified clinician, particularly when the pattern is new. If palpitations occur with chest pain, fainting or near-fainting, severe shortness of breath or marked dizziness, seek urgent medical help; call the local emergency service when symptoms are severe, new or ongoing.
Symptoms take priority over a reassuring score. A high HRV value does not rule out disease, and a low value does not diagnose it.
Frequently asked questions
Is higher HRV always better?
No. Interpretation depends on the person, rhythm, metric and measurement conditions. Extremely irregular intervals can also raise variability. Personal trends under comparable conditions are more useful than a universal contest.
Does low HRV mean I am stressed?
Not by itself. Stress may influence HRV, but sleep, training, illness, alcohol, breathing, posture, medication, artefact and normal variation can produce similar changes.
Does HRV measure the vagus nerve?
No. Some short-term HRV measures are influenced strongly by cardiac parasympathetic modulation, but HRV is the downstream timing output of several interacting systems.
Can a smartwatch diagnose an autonomic disorder?
No. A wearable can provide observations worth discussing, but diagnosis requires clinical history and appropriate medical assessment.
How long should I measure HRV?
Use the validated protocol for your device. For personal comparisons, consistency of device, posture, timing and recording length matters more than switching between protocols.
Sources and measurement standards
- ESC/NASPE Task Force (1996), “Heart rate variability: standards of measurement, physiological interpretation and clinical use.” PubMed record
- Šipinková et al. (1997), respiration and posture effects on HRV. PubMed
- Carrasco Sosa et al. (1999), body position, controlled breathing and exercise effects on HRV. PubMed
- Plews et al. (2017), smartphone PPG and electrode chest-strap RMSSD compared with ECG. PubMed
- Stone et al. (2021), accuracy of commercial resting HRV technologies. PubMed
- Quintana et al. (2017), controlled sleep deprivation and supine HRV. PubMed
- Yang et al. (2019), HRV recovery after repetitive sleep restriction. PubMed
- Brunner et al. (2021), controlled parenteral ethanol administration and cardiac autonomic regulation. PubMed
- Allen et al. (2014), randomized mental-stress HRV experiment. PubMed
- Verkuil et al. (2016), movement-calibrated HRV associations with worry and stress in daily life. PubMed
- Billman (2013), limitations of LF/HF as a sympathovagal balance measure. Frontiers
- Sacha (2013), mathematical and physiological interaction between average heart rate and HRV. PubMed
- Bellenger et al. (2016), systematic review and meta-analysis of HRV and athletic training status. PubMed
- Adam et al. (2023), systematic review of HRV, inflammation and infection. PubMed
- Zhang (2007), age- and sex-related HRV differences in healthy subjects. PubMed
- American Heart Association (2026), palpitations and warning symptoms. AHA